In most high school or undergraduate statistics courses we encounter the “bell curve” or the more technical phrase “normal distribution” with the standard (no pun intended) markings at 1 and 2 standard deviations from the mean.
Perhaps you’ve encountered something similar to the image below.
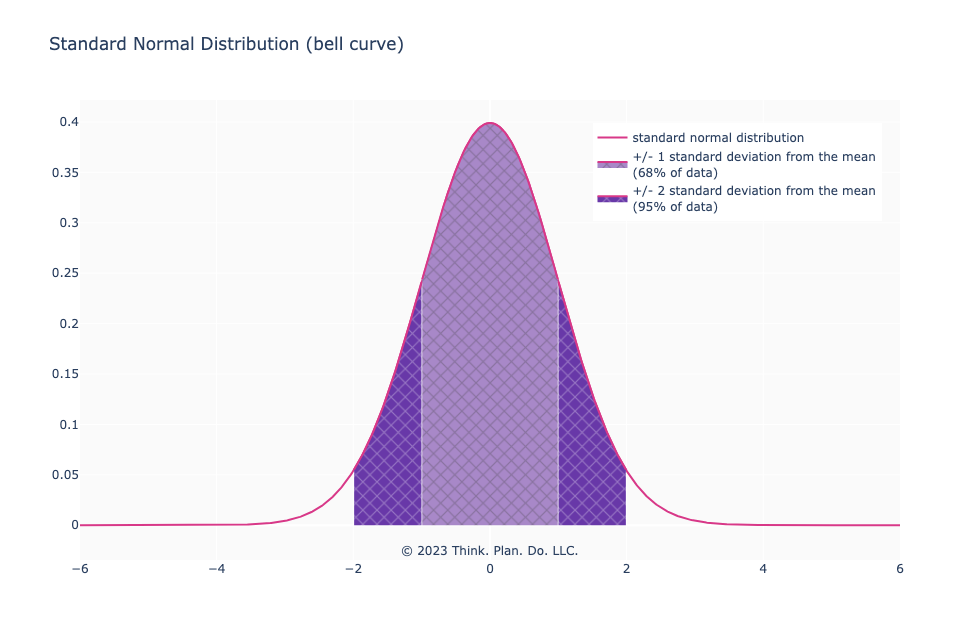
A few “facts”, terms, and subscripts are usually beaten into our brains:
- In hypothesis testing, a \(z\)-score of \(\pm\)2 standard deviations is considered significant
- Outliers are values that are 2 standard deviations away from the mean
- 68% of the data is within 1 standard deviation of the mean
- 95% of the data is within 2 standard deviations of the mean
- The mean, median, and mode are the same point (0 on a standard normal distribution)
- The distribution is symmetric
- something something Central Limit Theorem something something
All of this is good and well when data is distributed normally (like a bell curve). But, if you have a platform with (many) users, their behavior under almost any metric of engagement is not going to look like a normal distribution.
The Things We Get Wrong
Relying on facts from the normal distribution and assuming it holds for other distributions is where we get in trouble.
I’ve seen too many product managers and business executives use the \(\pm\)2 standard deviations from the mean as a cutoff to identify where outliers are on any metric; or assume that 95% of user behavior is within 2 standard deviations of the mean, or assume that the mean is telling of anything meaningful (some product managers opt for a median because it is “robust” to outliers — this too is a flawed measurement and a topic for another post (be on the lookout)).
These summary measures (mean (or median) and standard deviation) are then used as benchmarks for anomaly detection or to determine if user behavior has changed or observe trends in general.
If we were looking at the behavior of the mean, this would be fine (Central Limit Theorem). But product analytics views tend to focus on nominal data — percentage of users renewing, percentage of users taking action X, etc. These types of views tend to have distributions that are not Gaussian (bell curve) in shape. Instead behaviors look like the distributions below.
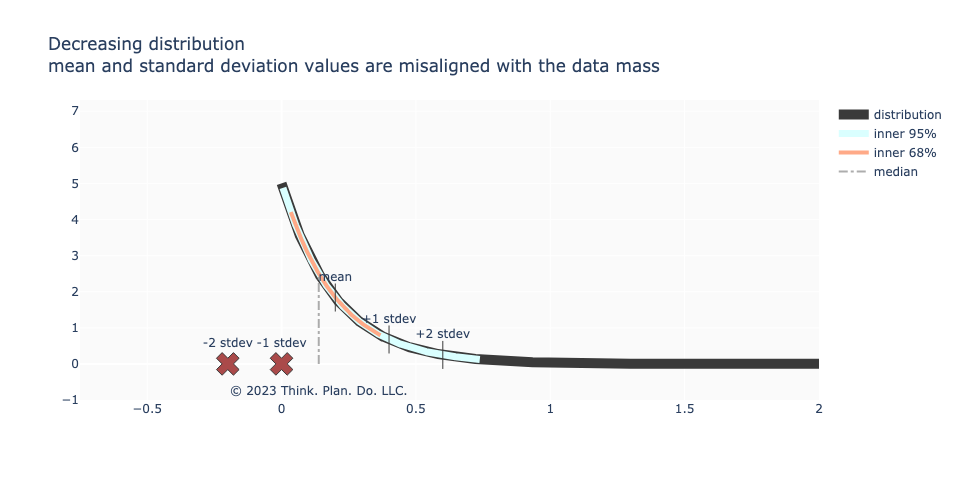
Here’s an example of the shape of user engagement behavior. Many users have low to moderate engagement with the product and a handful of “power users”. These tend to follow some type of “power law” distribution. You can see from the image below, that the distribution is not symmetric about the mean; the median and the mean are not co-incident; \(\pm\)2 standard deviations from the mean makes no contextual sense nor does it capture “95% of the data”.
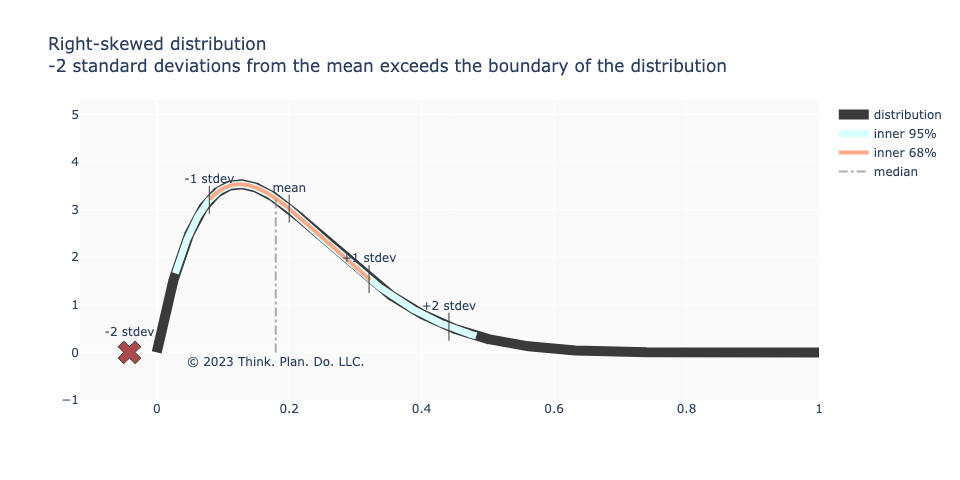
A close relative to the above image is the right-skewed distribution with a peak away from 0 like in the image below. Maybe there’s agreement that \(\pm\)1 standard deviation from the mean is roughly 68% of the data as in the normal distribution. However, -2 standard deviations from the mean puts us in territory outside of the distribution’s support! Worse still is that +2 standard deviations doesn’t represent “upper outliers” and for the “low outliers” that number is less than -2 standard deviations from the mean.
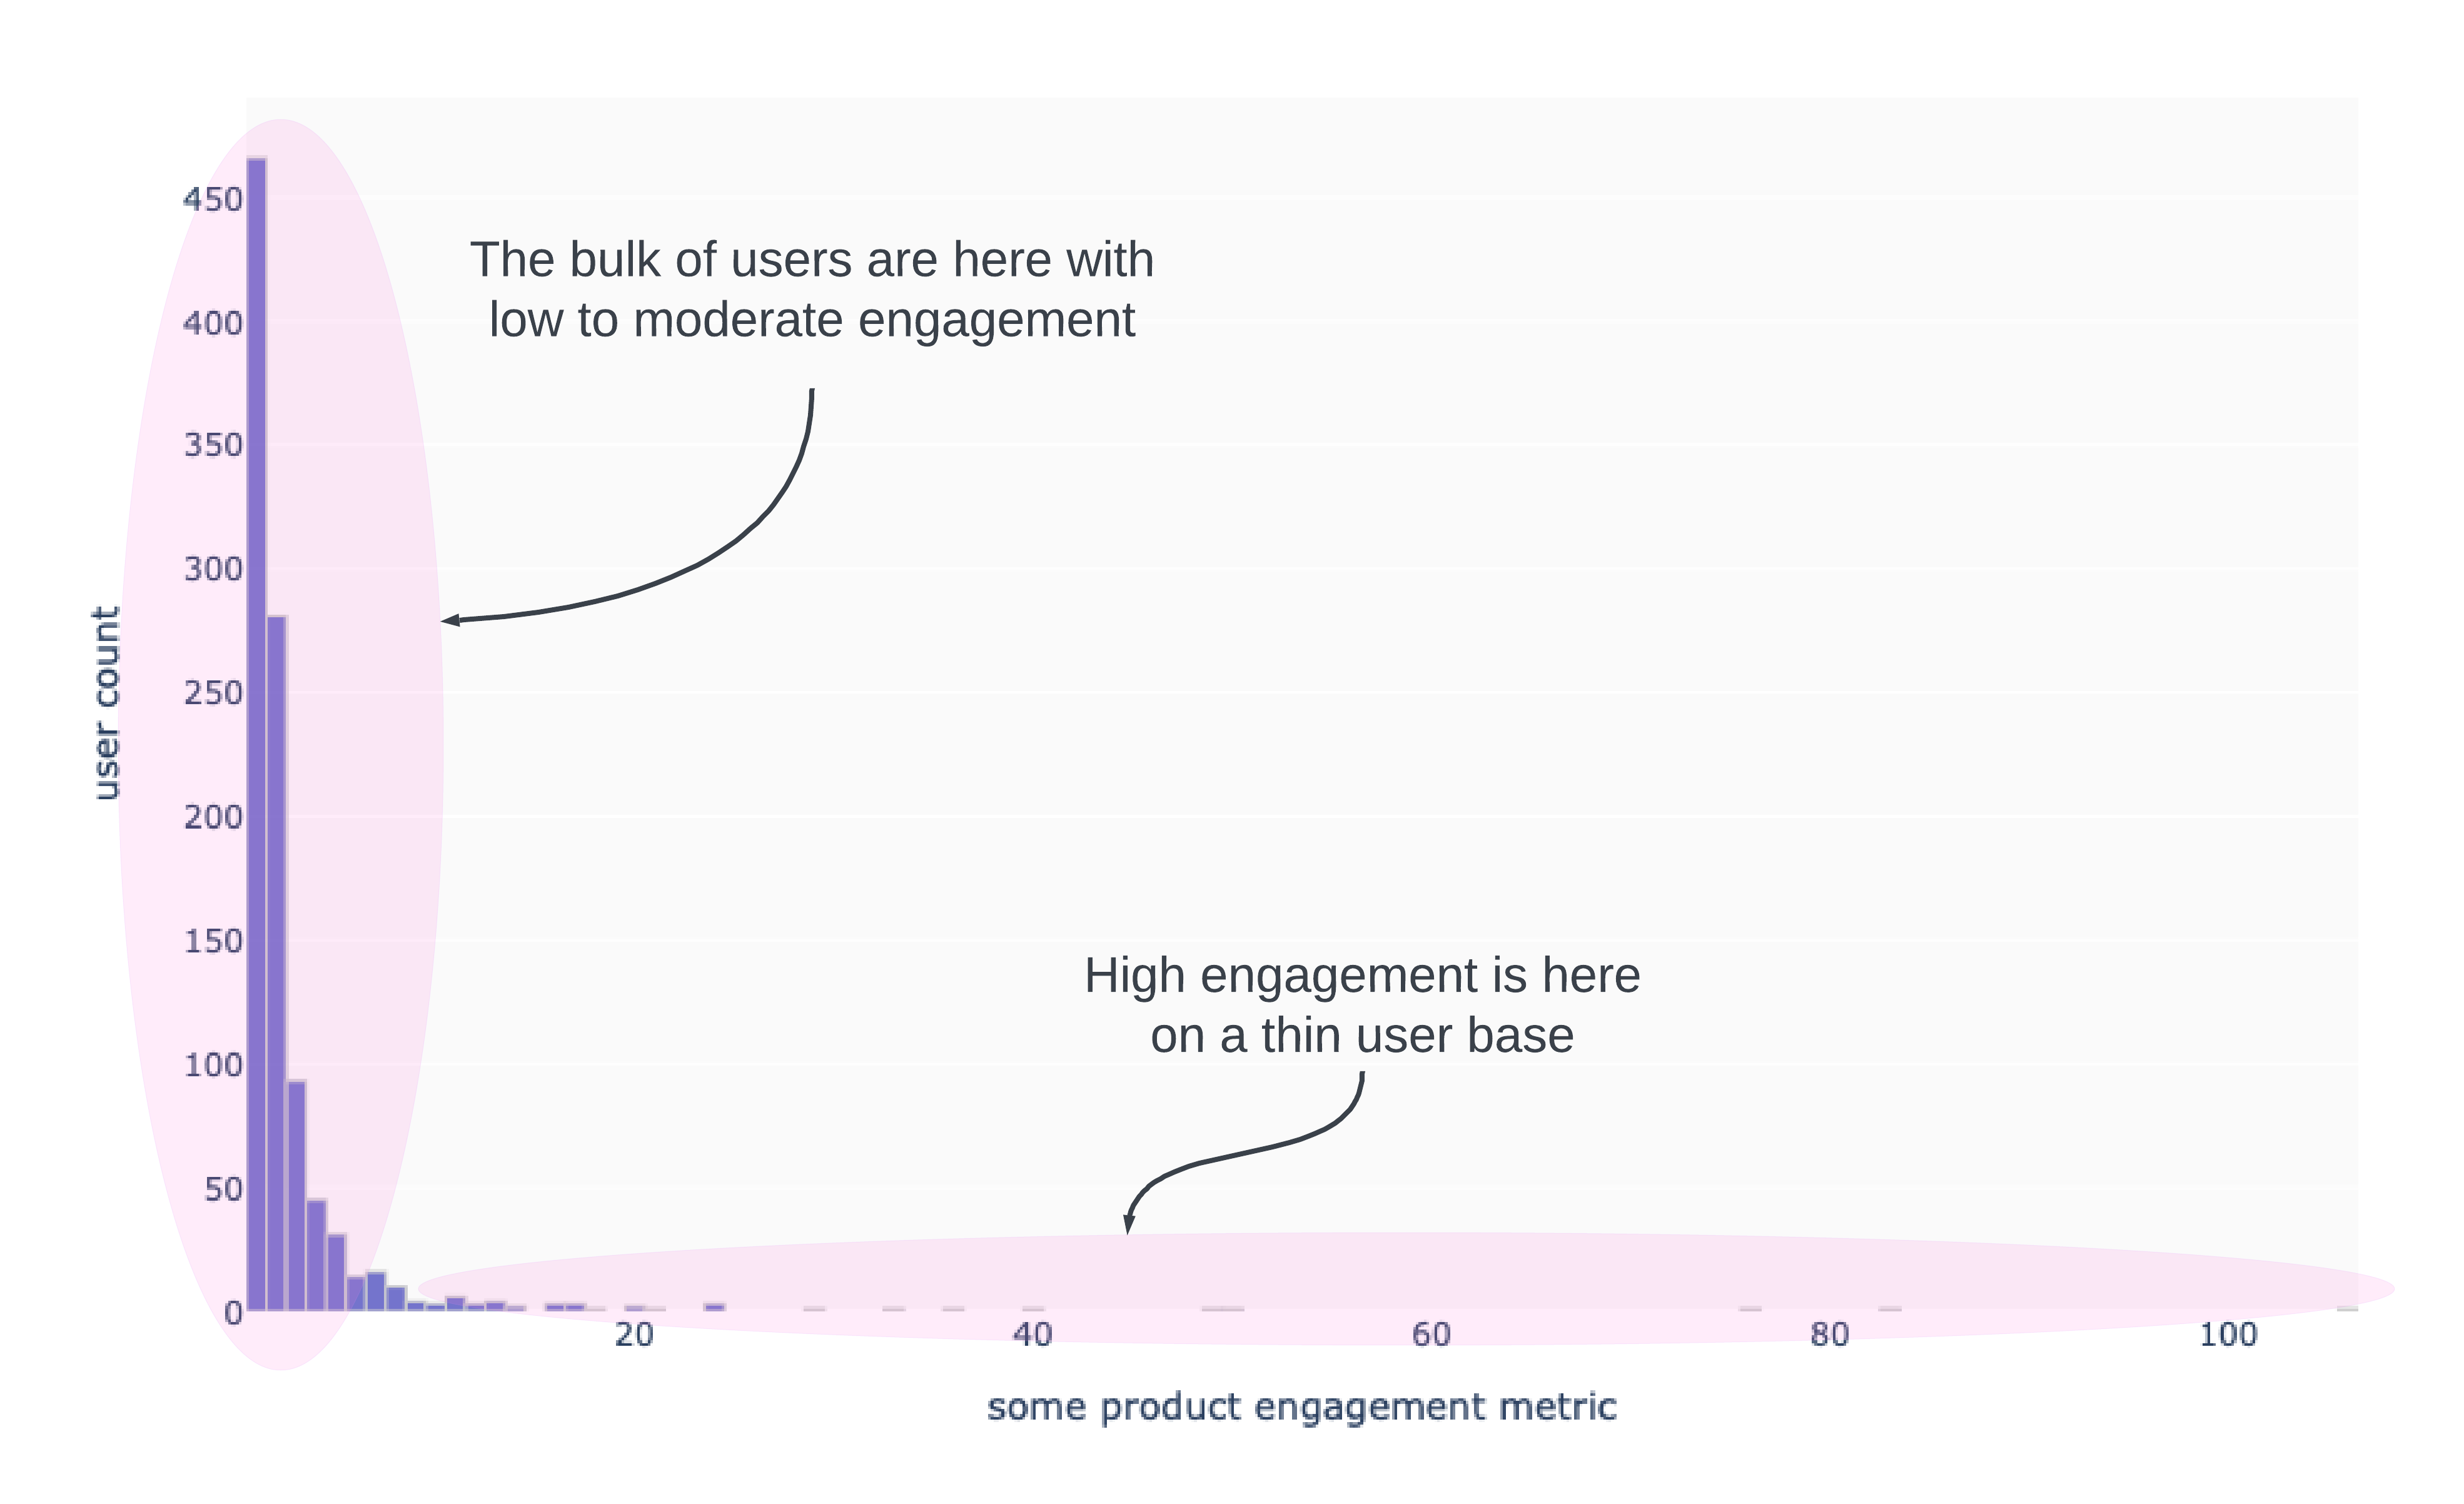
It’s not over! What gets us into even more trouble is that we are usually working with count data and the curve isn’t as smooth and idealized as the one above. But the histogram is more like the image below. The mean won’t be anywhere close to the center of the distribution! The standard deviation will be large because of the few, but highly engaged “power users”.
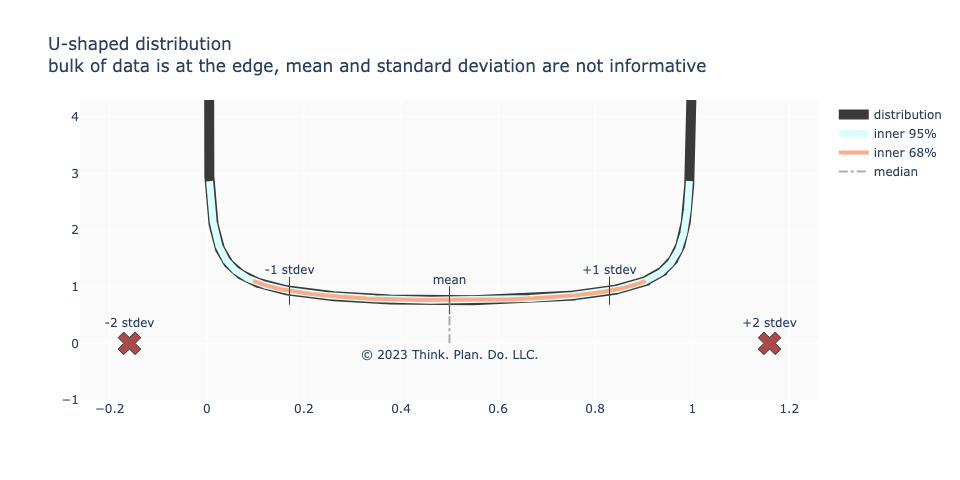
Next, we might have a “u-shaped” distribution. This happens sometimes when there is polarizing content or distinctly different preferences or plain human behavior / psychology (as is sometimes seen when users are given a low risk, medium risk, or high risk option to choose and users end up choosing either the low risk or the high risk eschewing the medium risk option). There is no “center” in the sense that the bulk of the mass is not located at the numerical center, but rather that the mass is concentrated on both ends of the distribution. Again, standard deviation fails to capture the range of the data and the mean fails to capture the mass / maximum likelihood of the data.
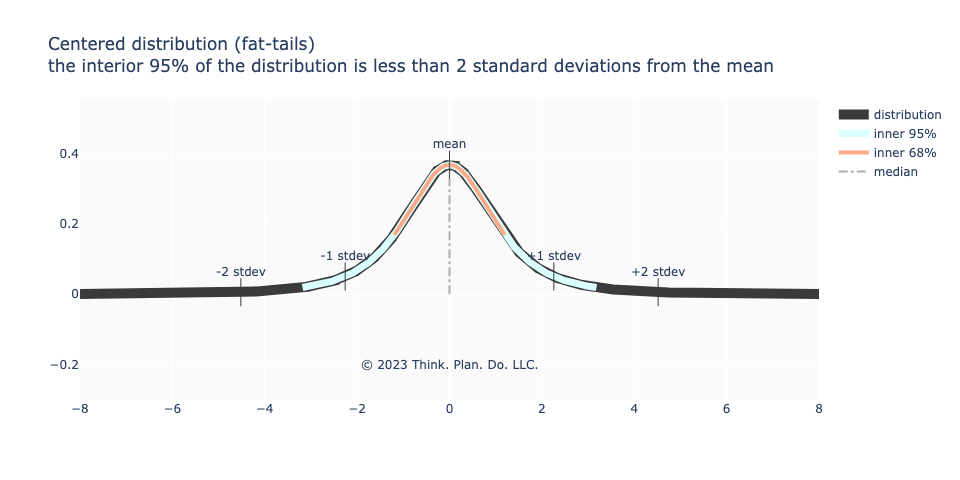
Sometimes, like in financial market data, even if the data’s maximum likelihood is or near the mean, we have what’s known as “fat tail” behavior. The eyeball metric might say that the distribution looks normal, but when we try to align the aggregate measures against what we would expect from a normal distribution, there is a strong deviation. In the image below, 1 standard deviation from the mean is more than 68% of the data, but 95% of the data is contained in less than 2 standard deviations from the mean.
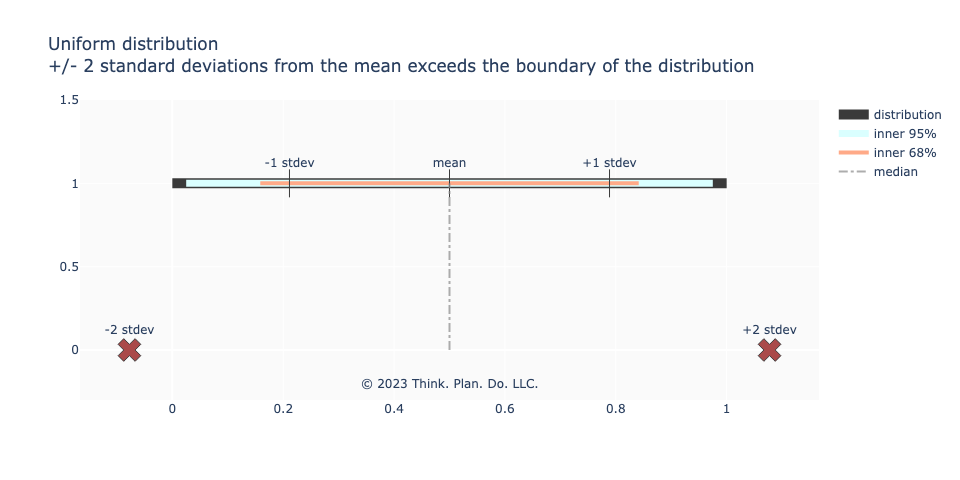
Finally, even the benign uniform distribution (equally weighted events) breaks from what we’d expect from the normal distribution. Two standard deviations from the mean is outside the distribution’s support!
What We’re Supposed To Do
The truth is these types of summary statistics are unhelpful in a product analytics context. Better is to look at and understand the distributions in their entirety and measure how the distribution changes as a shape rather than how some collection of summary statistics behave.
For outliers, the shortcut of \(\pm\)2 standard deviations from the mean is a conflation with setting a 95% boundary. Forget standard deviations, just work with percentiles.
The mean is not a reliable measure for the center of the data for many product analytics use cases, even though in the statistics literature the mean is considered a measure of “central tendency”. Look for where the mass of the data actually is. This is typically the mode. The median will tell you where the 50% mark is, but as we saw, if the distribution is u-shaped, the median isn’t where the data mass is.
Next on the list of articles coming are on a discussion around using median as a performance measurement (don’t do it!) and distributions users don’t like to feel.
In the meanwhile, reach out if you questions about data science, machine learning, business and product analytics, or general math help!