Many games that have a combat element have some type of rationale for determining damage dealt to the opponent. Sid Meier’s Civilization VI is the sixth installment in the series and it features, as it has in previous iterations, a combat element between military (and non-military) units. In this article, we’ll use the combat log file that the game saves to learn a thing or two about modeling and data analysis. If you are new to data science / data analytics, I hope you’ll find value in this. If you are well-versed in the methods, I hope you’ll give your thoughts on how you might have approached this. There’s more than one way to do this. If you are a business manager / executive and you’re trying to understand how your data science teams do their work, take this analysis as an example of what the process looks like on a sample data set. Finally, if you’re a teacher, I hope you will use this in your classroom! That’s the real point of this blog!
Some people have reported some formatting issues with the rest of the article. You can read this as a standalone article here.
from IPython.display import Image
Image(filename = "civattack.png")

Civilization VI, Unit Combat Analysis!
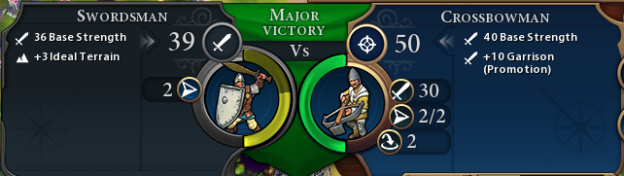
Can we try to reconstruct the math for combat in CIV VI? Why, in the above image, will the crossbowman take no damage and why does the swordsman lose almost half his health? This is what we want to explore. Maybe we can even extract a model for how damage is dealt?
Load libraries
Note: I despise using “np” as an alias for numpy and “pd” for pandas. So, I stick with “numpy” and “pandas”. Though, I prefer “plt” for pyplot. I also generally dislike doing things like “import sklearn.linear_model as linear_model”. I prefer to see the entire module path. With IDEs and even Jupyter notebooks, tab complete removes the keystroke saving arguments. As for style / readability. I find code to be more readable when the module is fully specified. Of course, there are limits to this. Anyway … let’s get on with it. 🙂
import math
import random
import itertools
import numpy
import scipy
import scipy.stats
import pandas
import sklearn
import sklearn.linear_model
import matplotlib
import matplotlib.pyplot as plt
Load Data
This can be found in /Documents/My Games/Sid Meier’s Civilization VI/Logs or the equivalent for your OS / computer set up
If you find the folder, look for a file called “combatlog.csv”. If you inspect it, you’ll notice that some columns have a “:” in them. The colon needs to be replaced by a comma.
combatdf = pandas.read_csv("CombatLog_forblog.csv", skipinitialspace = True)
Inspect Your File!
I can’t stress this enough, but you have to look at the data format and quality before beginning any analysis. Make sure that columns are aligned correctly, see if there is missing data, etc. The next few steps are a bunch of things to look at.
What columns do we have?
combatdf.columns
Use “describe”
“describe” is your friend. This is a small enough data set so I can spot check this with my eyes. For larger datasets, I would encourage that you write a wrapper around describe. Here, I want to do a few things.
- See which columns are numeric
- Make sure that the count for each column is the same (1193 in this case)
- The basic and default statistics that are computed are helpful in a number of ways.
- Is the standard deviation for any particular column zero? If it is, then you have a constant value. That may be an issue. It may not be. Depends on context.
- Knowing the range (max – min) is useful as well. For example, AttackerObjType and DefenderObjType look to be in a tight range. Whereas “Attacker Type” and “Defender Type” are spread out.
- Identifying which columns are actually numeric and which are categorical is helpful as well. AttackingCiv, DefendingCiv, AttackerObjType, DefenderObjType, Attacker Type, Defender Type, all appear to be categorical represented as numbers. The column names also suggests this.
- Notice that the “ID” columns are missing from describe
combatdf.describe()
It doesn’t hurt to look at the file
Since this data set is fairly small, we can print it directly to screen. Otherwise, we may want to inspect by printing out random subsamples. Regardless, pandas is pretty good to not actually display the entire dataset.
combatdf #notice that there are "UNKNOWN" unit types.
What did we want to do?
We’re interested in seeing how attacker strength and defender strength relate to how much damage each take in combat. But before we start, there’s still a bunch of investigating and general data exploration.
1-D Histograms are your friend
What kind of values are we working with? Are there boundary conditions? Are there obvious “visual” outliers? Just because the data formatting turned out to be ok, that doesn’t mean that the values are actually ok.
"""we can help ourselves a little bit by doing some automation. This print command is just a visual aid for me so that I
can more easily reference the needed columns without scrolling all around the notebook"""
for col in combatdf.describe():
    print(col)
columns_we_care_about = ['AttackerStr','DefenderStr','AttackerStrMod','DefenderStrMod','AttackerDmg','DefenderDmg']
nrows = 2
ncols = 3
fig, ax = plt.subplots(nrows = nrows, ncols = ncols, figsize = (12,8))
count = 0
describe = combatdf.describe()
for col in describe:
    if col not in columns_we_care_about:
        continue
    row_idx = count%nrows
    col_idx = count//nrows
    col_min = describe.loc['min'][col]
    col_max = describe.loc['max'][col]
    b = int(col_max - col_min + 1) #this is ok since by inspection of the data we see that the six columns we care about are integers
    counts, bins, patchobjs = ax[row_idx][col_idx].hist(combatdf[col],bins = b, alpha = 0.7, normed = True)
    ax[row_idx][col_idx].set_title(col)
    count += 1

What do you notice?
Given that this game is still only half way through and I’m playing on Price and am not a rockstar Civ player, unit strengths haven’t gotten too large [first column]. Though it looks like some civ or civs have units with strength over 100! [It’s over 9000!]
Next, for the attacker and defender strength modifiers, it looks like there are spikes at zero. That can make sense since it’s likely the case that unit vs unit combat probably happens most against unmodified units. Or at least that’s what it is implying about this game. You may also notice, by the eyeball metric, that there are also modification spikes around 5, 7, 10. If you’ve played the game then you know that in game bonuses to units come in those varieties. So that can also make sense. Finally, negative modifiers surely exist because units can be damaged (resulting in a negative modifier) and terrain can also harm a unit’s overall strength.
Finally, in the third column, for the damage that the attacker took (AttackerDmg), there is a spike at 0. We’ll have to investigate this. If you’ve played Civ VI, you may already have a guess as to why. Also, it looks clear that we have some natural boundary conditions. Units can’t take more than 100 in damage nor can they take negative damage. So that’s at least good in the sense that we don’t have outliers representing a data quality issue. For diehards of the game, you may know that later in the game it’s possible for damage to go beyond 100 when considering city attacks. But that hasn’t happened yet here.
Investigate AttackerDmg
We noticed a spike at zero for AttackerDmg. It’s not a bad idea to look to see what’s causing that. Now, here’s something to keep in mind. Knowing something about the context of the data is extremely helpful, more often than not. We don’t have to search in an unstructured, “non-parametric” way. The latter is how “sexy” data science is sold. In reality, you (a) don’t have time for this nonsense and (b) can use prior knowledge! In this case, we’re going to look at AttackerID and AttackerDmg to see if we can find any association. Let’s just query the data frame and see if any natural grouping pops out.
combatdf.query('AttackerDmg == 0')['AttackerID'].unique()
combatdf.query('AttackerDmg != 0')['AttackerID'].unique()
What do we notice?
You can see that the AttackerIDs for when AttackerDmg is zero and when it is not zero are disjoint. In other words, if the AttackerDmg is zero you won’t find that unit when AttackerDmg is not zero. In Civ VI there’s a distinction between ranged attacks and melee attacks. Melee attacks are when the defender can deal damage back to the attacker. Ranged attacks are one-sided — the attacker fires at the defender from “afar”. This is true for air units as well. Fighter vs Fighter is an “air melee” but Fighter vs non-anti-air unit is ranged. In any case, the point is, there are two different cases — when attacker damage is zero and when it is not.
One note: this way of separation may not be general enough. It could be possible (air vs air or air vs ground anti-air) that a unit type (or more generally, an attacker type) shows up in both cases. However, the overall point should be clear. When attacker damage is zero, it is a ranged attack. If it is not a ranged attack, the attacker will take some non-zero damage.
Next, it might help to put together some scatter plots. This first one is just looking at the damage the attacker took against the damage the defender took on a per record basis. To be clear, this isn’t how combat works. In actuality, the attacker and defender strengths are what cause damage to the attacker and defender. But it may be interesting just to see what kind of relationship might exist, if any.
plt.scatter(combatdf['AttackerDmg'],combatdf['DefenderDmg'],alpha = 0.7, marker = '.')
plt.xlabel('Damage to attacker')
plt.ylabel('Damage to defender')

How interesting!
So this is interesting! Ignoring the boundary condtions on both the horizontal and vertical axes (0 and 100), it certainly looks like there is some parity between how much damage an attacker takes and how much damage a defender takes. In other words, if the attacker takes a small amount of damage, odds are the defender is taking a high amount of damage and vice versa. So there is a level curve on which damage is dealt. It also appears that there is a small amount of randomness incorporated into combat.
We’re not going to try to model this, but if you’re interested, give it a try! I would recommend that if you want to fit a model, then exclude all cases when the attacker damage is 0 or 100 and same for defender. These are boundary conditions that will make a mess of most parametric models. Also, exclude all data involving districts.
Another quick investigation
Let’s just take a look at what type of ids we are working with. We can see from below that we have “DISTRICT”, “UNIT”, and “UNKNOWN” types. For this investigation, let’s keep our focus on UNIT vs UNIT and separate by what kind of damage the attacker took. Let’s also throw out religious units.
numpy.array(sorted(combatdf['AttackerID'].unique().tolist() + combatdf['DefenderID'].unique().tolist()))
unit_combatdf = combatdf[combatdf['AttackerID'].str.contains("UNIT") & combatdf['DefenderID'].str.contains("UNIT") & \
                         ~combatdf['AttackerID'].str.contains('APOSTLE') & ~combatdf['DefenderID'].str.contains('APOSTLE') &\
                        ~combatdf['AttackerID'].str.contains('INQUISITOR') & ~combatdf['DefenderID'].str.contains('INQUISITOR')]
numpy.array(sorted(unit_combatdf['AttackerID'].unique().tolist() + unit_combatdf['DefenderID'].unique().tolist()))
Replot
It’s good to compare this plot against the plot above for a quick visual about what we’ve excluded.
plt.scatter(unit_combatdf['AttackerDmg'],unit_combatdf['DefenderDmg'],alpha = 0.7, marker = '.')
plt.xlabel('Damage to attacker')
plt.ylabel('Damage to defender')

outliers?
There’s one point that looks a little strange.
unit_combatdf.query("AttackerDmg < 10 and DefenderDmg < 50 and AttackerDmg > 0")
Well?
That one attack looks legitimate from a data formatting standpoint, but certainly appears a bit outside the visual clustering. We would have expected that if the defender took almost 50 points of damage, the attacker should’ve taken damage close to 20 points. Let’s keep this in mind, but leave the point in our data set for now. There are two other points that look visually askew, but we can be here all day scrutinizing every point. So let’s not bother.
Melee vs Ranged
Let’s make two dataframes. One for melee and one for ranged.
meleedf = unit_combatdf.query('AttackerDmg > 0')
rangedf = unit_combatdf.query('AttackerDmg == 0')
Incorporating attacker and defender strengths
So far, we had looked at just the output — the damage done to the attacker and the defender. Odds are, this damage is dependent on the attacker and defender strengths (AttackerStr and DefenderStr, respectively). There are also two columns for modifiers to the strength.
Again, if you played the game then you know that the modifiers are additive. So the “net” attacker strength is the sum of the base strength (AttackerStr) and the modifier (AttackerStrMod). The same goes for the defender. So let’s just add a column in both of our data frames for this net strength.
cols = [('AttackerStr','AttackerStrMod','AttackerNetStr'),('DefenderStr','DefenderStrMod','DefenderNetStr')]
for c in cols:
    t = pandas.DataFrame(meleedf[c[0]] + meleedf[c[1]],columns = [c[2]])
    meleedf[c[2]] = meleedf[c[0]] + meleedf[c[1]]
    t = pandas.DataFrame(rangedf[c[0]] + rangedf[c[1]],columns = [c[2]])
    rangedf[c[2]] = rangedf[c[0]] + rangedf[c[1]]
meleedf.columns
Exploration of net strength
Garbage in, garbage out. It’s good to check up on the inputs just like we did for the outputs.
fig, ax = plt.subplots(nrows = 1, ncols = 2, figsize = (12,6))
ax[0].scatter(meleedf['AttackerStr'],meleedf['DefenderStr'],alpha = 0.7, marker = '.')
ax[0].set_xlabel('Attacker Strength')
ax[0].set_ylabel('Defender Strength')
ax[0].set_title('Melee')
ax[1].scatter(rangedf['AttackerStr'],rangedf['DefenderStr'],alpha = 0.7, marker = '.')
ax[1].set_xlabel('Attacker Strength')
ax[1].set_ylabel('Defender Strength')
ax[1].set_title('Range')

fig, ax = plt.subplots(nrows = 1, ncols = 2, figsize = (12,6))
ax[0].scatter(meleedf['AttackerNetStr'],meleedf['DefenderNetStr'],alpha = 0.7, marker = '.')
ax[0].set_xlabel('Attacker Net Strength')
ax[0].set_ylabel('Defender Net Strength')
ax[0].set_title('Melee')
ax[1].scatter(rangedf['AttackerNetStr'],rangedf['DefenderNetStr'],alpha = 0.7, marker = '.')
ax[1].set_xlabel('Attacker Net Strength')
ax[1].set_ylabel('Defender Net Strength')
ax[1].set_title('Range')

Some comments
The above graphs show how the combat match ups from base strength become more clumped after adjusting for the modifiers, especially for melee. That makes sense to some extent since if we assume that all players are rational and won’t routinely put their troops in harm’s way needlessly. Of course, someone will be stronger and someone will be weaker from time to time, but the disparities don’t appear to be large (we can look at ratios if we want).
However, net negative values for attacker and defender strengths are a bit of a concern. Let’s take a look at those cases first and see if anything pops out. Odds are, with terrain modifiers and damage the unit may have already taken, it’s possible net strength can be negative. But peeking at the data doesn’t hurt.
meleedf.query('AttackerNetStr < 0 or DefenderNetStr < 0')
rangedf.query('AttackerNetStr < 0 or DefenderNetStr < 0')
Notice anything? All of these cases except for one in range-type attacks involve Civ #63. Barbarians. The modifier involved isn’t excessive. The base strength was low enough that net negative would be possible. So I’m not really worried about this. But it’s good to know! Let’s take a quick look at attacker and defender net strength against the civilization id. I’m civilization index 0, if you care.
acivs = sorted(meleedf['Attacking Civ'].unique())
dcivs = sorted(meleedf['DefendingCiv'].unique())
fig, ax = plt.subplots(nrows = 1, ncols = 2, figsize = (12,6),sharey = True)
boxplot = ax[0].boxplot([meleedf[meleedf['Attacking Civ'] == v]['AttackerNetStr'].values for v in acivs], acivs,
                     labels = acivs, bootstrap = 10000)
boxplot = ax[0].set_xlabel('Attacking Civ')
boxplot = ax[0].set_ylabel('Net Strength')
boxplot = ax[1].boxplot([meleedf[meleedf['DefendingCiv'] == v]['DefenderNetStr'].values for v in dcivs], dcivs,
                     labels = dcivs, bootstrap = 10000)
boxplot = ax[1].set_xlabel('Defending Civ')
boxplot = ax[1].set_ylabel('Net Strength')
fig.suptitle('Melee')

acivs = sorted(rangedf['Attacking Civ'].unique())
dcivs = sorted(rangedf['DefendingCiv'].unique())
fig, ax = plt.subplots(nrows = 1, ncols = 2, figsize = (12,6),sharey = True)
boxplot = ax[0].boxplot([rangedf[rangedf['Attacking Civ'] == v]['AttackerNetStr'].values for v in acivs], acivs,
                     labels = acivs, bootstrap = 10000)
boxplot = ax[0].set_xlabel('Attacking Civ')
boxplot = ax[0].set_ylabel('Net Strength')
boxplot = ax[1].boxplot([rangedf[rangedf['DefendingCiv'] == v]['DefenderNetStr'].values for v in dcivs], dcivs,
                     labels = dcivs, bootstrap = 10000)
boxplot = ax[1].set_xlabel('Defending Civ')
boxplot = ax[1].set_ylabel('Net Strength')
fig.suptitle('Range')

This all looks reasonable. Sanity checks are useful before we start doing analysis. Let’s do one more survey of our data — the modifiers.
acivs = sorted(meleedf['Attacking Civ'].unique())
dcivs = sorted(meleedf['DefendingCiv'].unique())
fig, ax = plt.subplots(nrows = 1, ncols = 2, figsize = (12,6),sharey = True)
boxplot = ax[0].boxplot([meleedf[meleedf['Attacking Civ'] == v]['AttackerStrMod'].values for v in acivs], acivs,
                     labels = acivs, bootstrap = 10000)
boxplot = ax[0].set_xlabel('Attacking Civ')
boxplot = ax[0].set_ylabel('Strength Modifier')
boxplot = ax[1].boxplot([meleedf[meleedf['DefendingCiv'] == v]['DefenderStrMod'].values for v in dcivs], dcivs,
                     labels = dcivs, bootstrap = 10000)
boxplot = ax[1].set_xlabel('Defending Civ')
boxplot = ax[1].set_ylabel('Strength Modifier')
fig.suptitle('Melee')

acivs = sorted(rangedf['Attacking Civ'].unique())
dcivs = sorted(rangedf['DefendingCiv'].unique())
fig, ax = plt.subplots(nrows = 1, ncols = 2, figsize = (12,6),sharey = True)
boxplot = ax[0].boxplot([rangedf[rangedf['Attacking Civ'] == v]['AttackerStrMod'].values for v in acivs], acivs,
                     labels = acivs, bootstrap = 10000)
boxplot = ax[0].set_xlabel('Attacking Civ')
boxplot = ax[0].set_ylabel('Strength Modifier')
boxplot = ax[1].boxplot([rangedf[rangedf['DefendingCiv'] == v]['DefenderStrMod'].values for v in dcivs], dcivs,
                     labels = dcivs, bootstrap = 10000)
boxplot = ax[1].set_xlabel('Defending Civ')
boxplot = ax[1].set_ylabel('Strength Modifier')
fig.suptitle('Range')

Again, things look reasonable. Though it looks like civilizations index 11 and 19 seem to attack with significant negative modification to range attacks. Barbarians generally are terrible.
Now let’s take a look at our attacker and defender net strengths against the damage they take. But how to do this? Once again, let’s think about the game itself. Does it seem sensible that we look at the difference between the attacker and defender net strengths or their ratio or something else? I want to reject ratio because of the possibility of division by zero and that strengths can go negative. Difference seems like a good first start. So let’s take a look.
fig, ax = plt.subplots(nrows = 1, ncols = 2, figsize = (12,6), sharey = True, sharex = True)
ax[0].scatter(meleedf['AttackerNetStr']-meleedf['DefenderNetStr'],meleedf['DefenderDmg'],marker = '.', alpha = 0.7, label = 'Defender')
ax[0].scatter(meleedf['AttackerNetStr']-meleedf['DefenderNetStr'],meleedf['AttackerDmg'],marker = '.', alpha = 0.7, label = 'Attacker')
ax[0].legend(loc = 6)
ax[0].set_xlabel('Net Strength Differential (Attacker - Defender)')
ax[0].set_ylabel('Damage Taken')
ax[0].set_title('Melee')
ax[1].scatter(rangedf['AttackerNetStr']-rangedf['DefenderNetStr'],rangedf['DefenderDmg'],marker = '.', alpha = 0.7, label = 'Defender')
ax[1].legend(loc = 6)
ax[1].set_xlabel('Net Strength Differential (Attacker - Defender)')
ax[1].set_ylabel('Damage Taken')
ax[1].set_title('Range')

Well, that’s not bad! Clearly, there’s a functional form here. Likely exponential if I had to guess. Of course, there’s a hard cap of 100 and a hard floor of 0. The melee graph corroborates something we saw earlier — that there seems to be some zero-sum type parity between the amount of damage the attacker and defender take. Out of curiosity, let’s just look at the sum of attacker damage and defender damage for melee.
fig, ax = plt.subplots(nrows = 1, ncols = 1, figsize = (8,8), sharey = True, sharex = True)
ax.scatter(meleedf['AttackerNetStr']-meleedf['DefenderNetStr'],meleedf['AttackerDmg'] + meleedf['DefenderDmg'],marker = '.', alpha = 0.7, label = 'Attacker + Defender Damage')
ax.legend(loc = 9)
ax.set_xlabel('Net Strength Differential (Attacker - Defender)')
ax.set_ylabel('Sum of Damage Taken')
ax.set_title('Melee')

Interesting! What’re your guesses? Quadratic? Hyperbolic?
Let’s see if we can fit an exponential to the damage the defender takes based on the net strength differential between attacker and defender. To do this, we’ll “linearize” the data with a log transformation. But we’ll also get rid of the boundary condition values of 0 and 100 from the damage taken. Normally, I’d look to rescale the data to be centered around zero, but in this case, the numbers are generally tame and the behavior looks well-defined enough that I’ll bypass these additional steps.
First let’s plot the log transformed data along side with square-rooted data — we’ll do melee for defender damage taken.
data = meleedf.query('DefenderDmg > 0 and DefenderDmg < 100')
x = data['AttackerNetStr']-data['DefenderNetStr']
y1 = numpy.log(data['DefenderDmg'])
y2 = numpy.sqrt(data['DefenderDmg'])
plt.scatter(x,y1,marker = '.', alpha = 0.7,label = 'log transform')
plt.scatter(x,y2,marker = '.', alpha = 0.7,label = 'sqrt transform')
plt.legend()
plt.ylabel('Transformed Defender Damage')
plt.xlabel('Net Strength Differential')

Looks pretty clear that a log transform is more appropriate, suggesting an exponential form relating the difference between attacker and defender net strength and the damage the defender takes. There are ways for us to automatically detect this, but it’s a bit out of scope here. Additionally, it’s ok to look at the graphs!
Now, let’s set up a linear regression on the log transformed data.
reg = sklearn.linear_model.LinearRegression()
reg.fit(x.values.reshape(-1,1),y1)
reg.coef_, reg.intercept_
Ok, so we have regression coefficients, but they are on the log transformed data. In other words, we fitted the model $\log(y) = mx + b$ where $y$ is the defender damage and $x$ is the difference between net attacker strength and net defender strength. So, to get back $y$, we have $y = e^{mx + b}$
xs = numpy.linspace(-60,40,121)
plt.plot(xs,[min(v,100) for v in numpy.exp(reg.coef_[0]*xs + reg.intercept_)],label = 'fit',alpha = 0.7, color = 'black')
plt.scatter(x,numpy.exp(y1),label = 'actual', alpha = 0.7, marker = '.')
plt.legend()
plt.xlabel('Net Strength Differential')
plt.ylabel('Defender Damage Taken')
plt.title('Melee')

That looks beautiful!
What about attacker damage? We should be able to model that with the same process.
data = meleedf.query('AttackerDmg > 0 and AttackerDmg < 100')
x = data['AttackerNetStr']-data['DefenderNetStr']
y1 = numpy.log(data['AttackerDmg'])
y2 = numpy.sqrt(data['AttackerDmg'])
plt.scatter(x,y1,marker = '.', alpha = 0.7,label = 'log transform')
plt.scatter(x,y2,marker = '.', alpha = 0.7,label = 'sqrt transform')
plt.legend()
plt.ylabel('Transformed Attacker Damage')
plt.xlabel('Net Strength Differential')

Again, we’ll go with a log transform.
reg = sklearn.linear_model.LinearRegression()
reg.fit(x.values.reshape(-1,1),y1)
reg.coef_, reg.intercept_
Oooh. Compare these coefficients against those found for defender damage taken! It indeed looks like the sum of the damage taken is a type of hyperbolic cosine.
xs = numpy.linspace(-60,40,121)
plt.plot(xs,[min(v,100) for v in numpy.exp(reg.coef_[0]*xs + reg.intercept_)],label = 'fit',alpha = 0.7, color = 'black')
plt.scatter(x,numpy.exp(y1),label = 'actual', alpha = 0.7, marker = '.')
plt.legend()
plt.xlabel('Net Strength Differential')
plt.ylabel('Attacker Damage Taken')
plt.title('Melee')

Visually, this looks like a pretty solid fit.
reg.score(x.values.reshape(-1,1),y1)
That $R^{2}$ looks pretty good!
There’s a bunch of other stuff we can do to tighten this analysis up. But this really depends on what we want to do. In my case, I just want to understand what extra strength really means and how much is necessary. From looking at the model and the graphs, it looks like if I am attacking and I have a +30 advantage, the defender is taking full damage. If we were at parity then we’re both taking about 30 points of damage. So, let’s just print out a table with attacker and defender damage taken based on our model. I haven’t done an explicit hypothesis test on the coefficients, but suffice to say it looks like the slopes are equal up to a sign change and the intercepts are the same between attacker and defender damage. So, all else being equal, let’s take a slope of 0.038 and intercept of 3.38.
xs = numpy.linspace(-35,35,15)
slope = .038
intercept = 3.38
ydefender = numpy.exp(slope*xs + intercept)
yattacker = numpy.exp(-slope*xs + intercept)
modeldf = pandas.DataFrame(numpy.array([xs.tolist(),ydefender.tolist(),yattacker.tolist()]).T,columns = ['StrengthDiff','DefenderDamage','AttackerDamage'])
modeldf
Why don’t you try to model defender damage on range attacks?
Oh, one last thing. I didn’t do this, but you can certainly try. Can you figure out how much random fluctuation there is? The model we derived is a least-squares best fit, ie, an average model (average minimizes square error). We’re not going to get every point exactly correct. The variation around our model is the implicit unexplained variance — error. Clearly, the game designers added some randomness to combat. But not so much randomness that their underlying model was washed away. Rather just enough so that all combats aren’t exactly the same. Or it could be that there are other deterministic factors that contribute to the damage taken. If there are, we don’t have access to them from the combatlog.csv file. This is reality! From our model’s standpoint, everything the model can’t explain is “random”, unexplained variance.
This is a cool exercise in data modeling! I really liked the use of the Civ data and how you walked the reader through exploring, questioning, reasoning, and interpreting the data. I disagree with your rejection of np, pd, and the likes, but hey, namespaces are one honking great idea, and readability counts. Anyway, nice post you got here!