What happens when the immovable object (median) meets the unstoppable force (user behavior)?
Our product fails!
Before we get into the math, let’s keep this quote from Eliyahu Goldratt in mind “Tell me how you will measure me and I will tell you how I will behave.”
Setting a north star metric for a product or product feature is a standard part of a product manager’s repertoire for keeping product development focused through measurement.
But north star metrics fail our product in three ways.
- Variations on Goldratt: Does the music play the musician or does the musician play the music? Are you measuring your product or has your product become the measurement? Is your product optimizing for top of funnel metrics, conversion rates, engagement rates? Do you find yourself trying to game the metric by building features to optimize the metric? Or is your product addressing your clients’ / users’ needs and you’re using data and measurement to make sure this is happening?
- One Size Fits All: On one extreme is having too many metrics which leads to analysis paralysis and ultimately abandonment of measurement. On the other extreme is excessive simplification and boiling down a dynamic, complex product into a single measure of value. When this happens we miss out on product development approaches that would lead to an overall better product — the whole is greater than the sum of the parts. Reductionist approaches to product development where each feature needs to show positive impact to the north star metric is “greedy development” — greedy algorithms are not always optimal. Better is to have multiple metrics of measurement and seek global optimization where we are not necessarily seeking the highest retention or the highest conversion rate or shortest time to monetization or any singular metric optimization, but rather an optimal balance. When we try to optimize for one metric, we may be severely penalizing others.
- Let’s say we have a 11-point scale, where 10 is the best value for the metric, and 0 is the worst value (e.g., retention of 100% would be a 10 and retention of 0% would be 0, or time to monetization of less than 1 day might be a 10 but time to monetization greater than 30 days might be a 0). Would you rather a product have a score like (9, 6, 4) on (retention, time to first purchase, product engagement) or would you rather have one that is (7, 7, 5)? It’s subjective for sure and a retention score of 9 is attractive at the expense of time to first purchase and product engagement. What about (9, 2, 2) vs (7, 7, 5)? You see if we focus on just retention is an example north star metric, we might end up in a world of 2s on other metrics without ever really knowing or paying attention to that sacrifice.
- The Wrong Measurement: This is how I started this article. Let’s dig in in the next section.
The Immovable Object Against The Unstoppable Force
As your user base grows, so does extreme activity in your product. If you have a content creation platform you might see users uploading thousands of pieces of content in a day, but the majority of users upload only 0 to 1 pieces of content per day. The image below is an example.
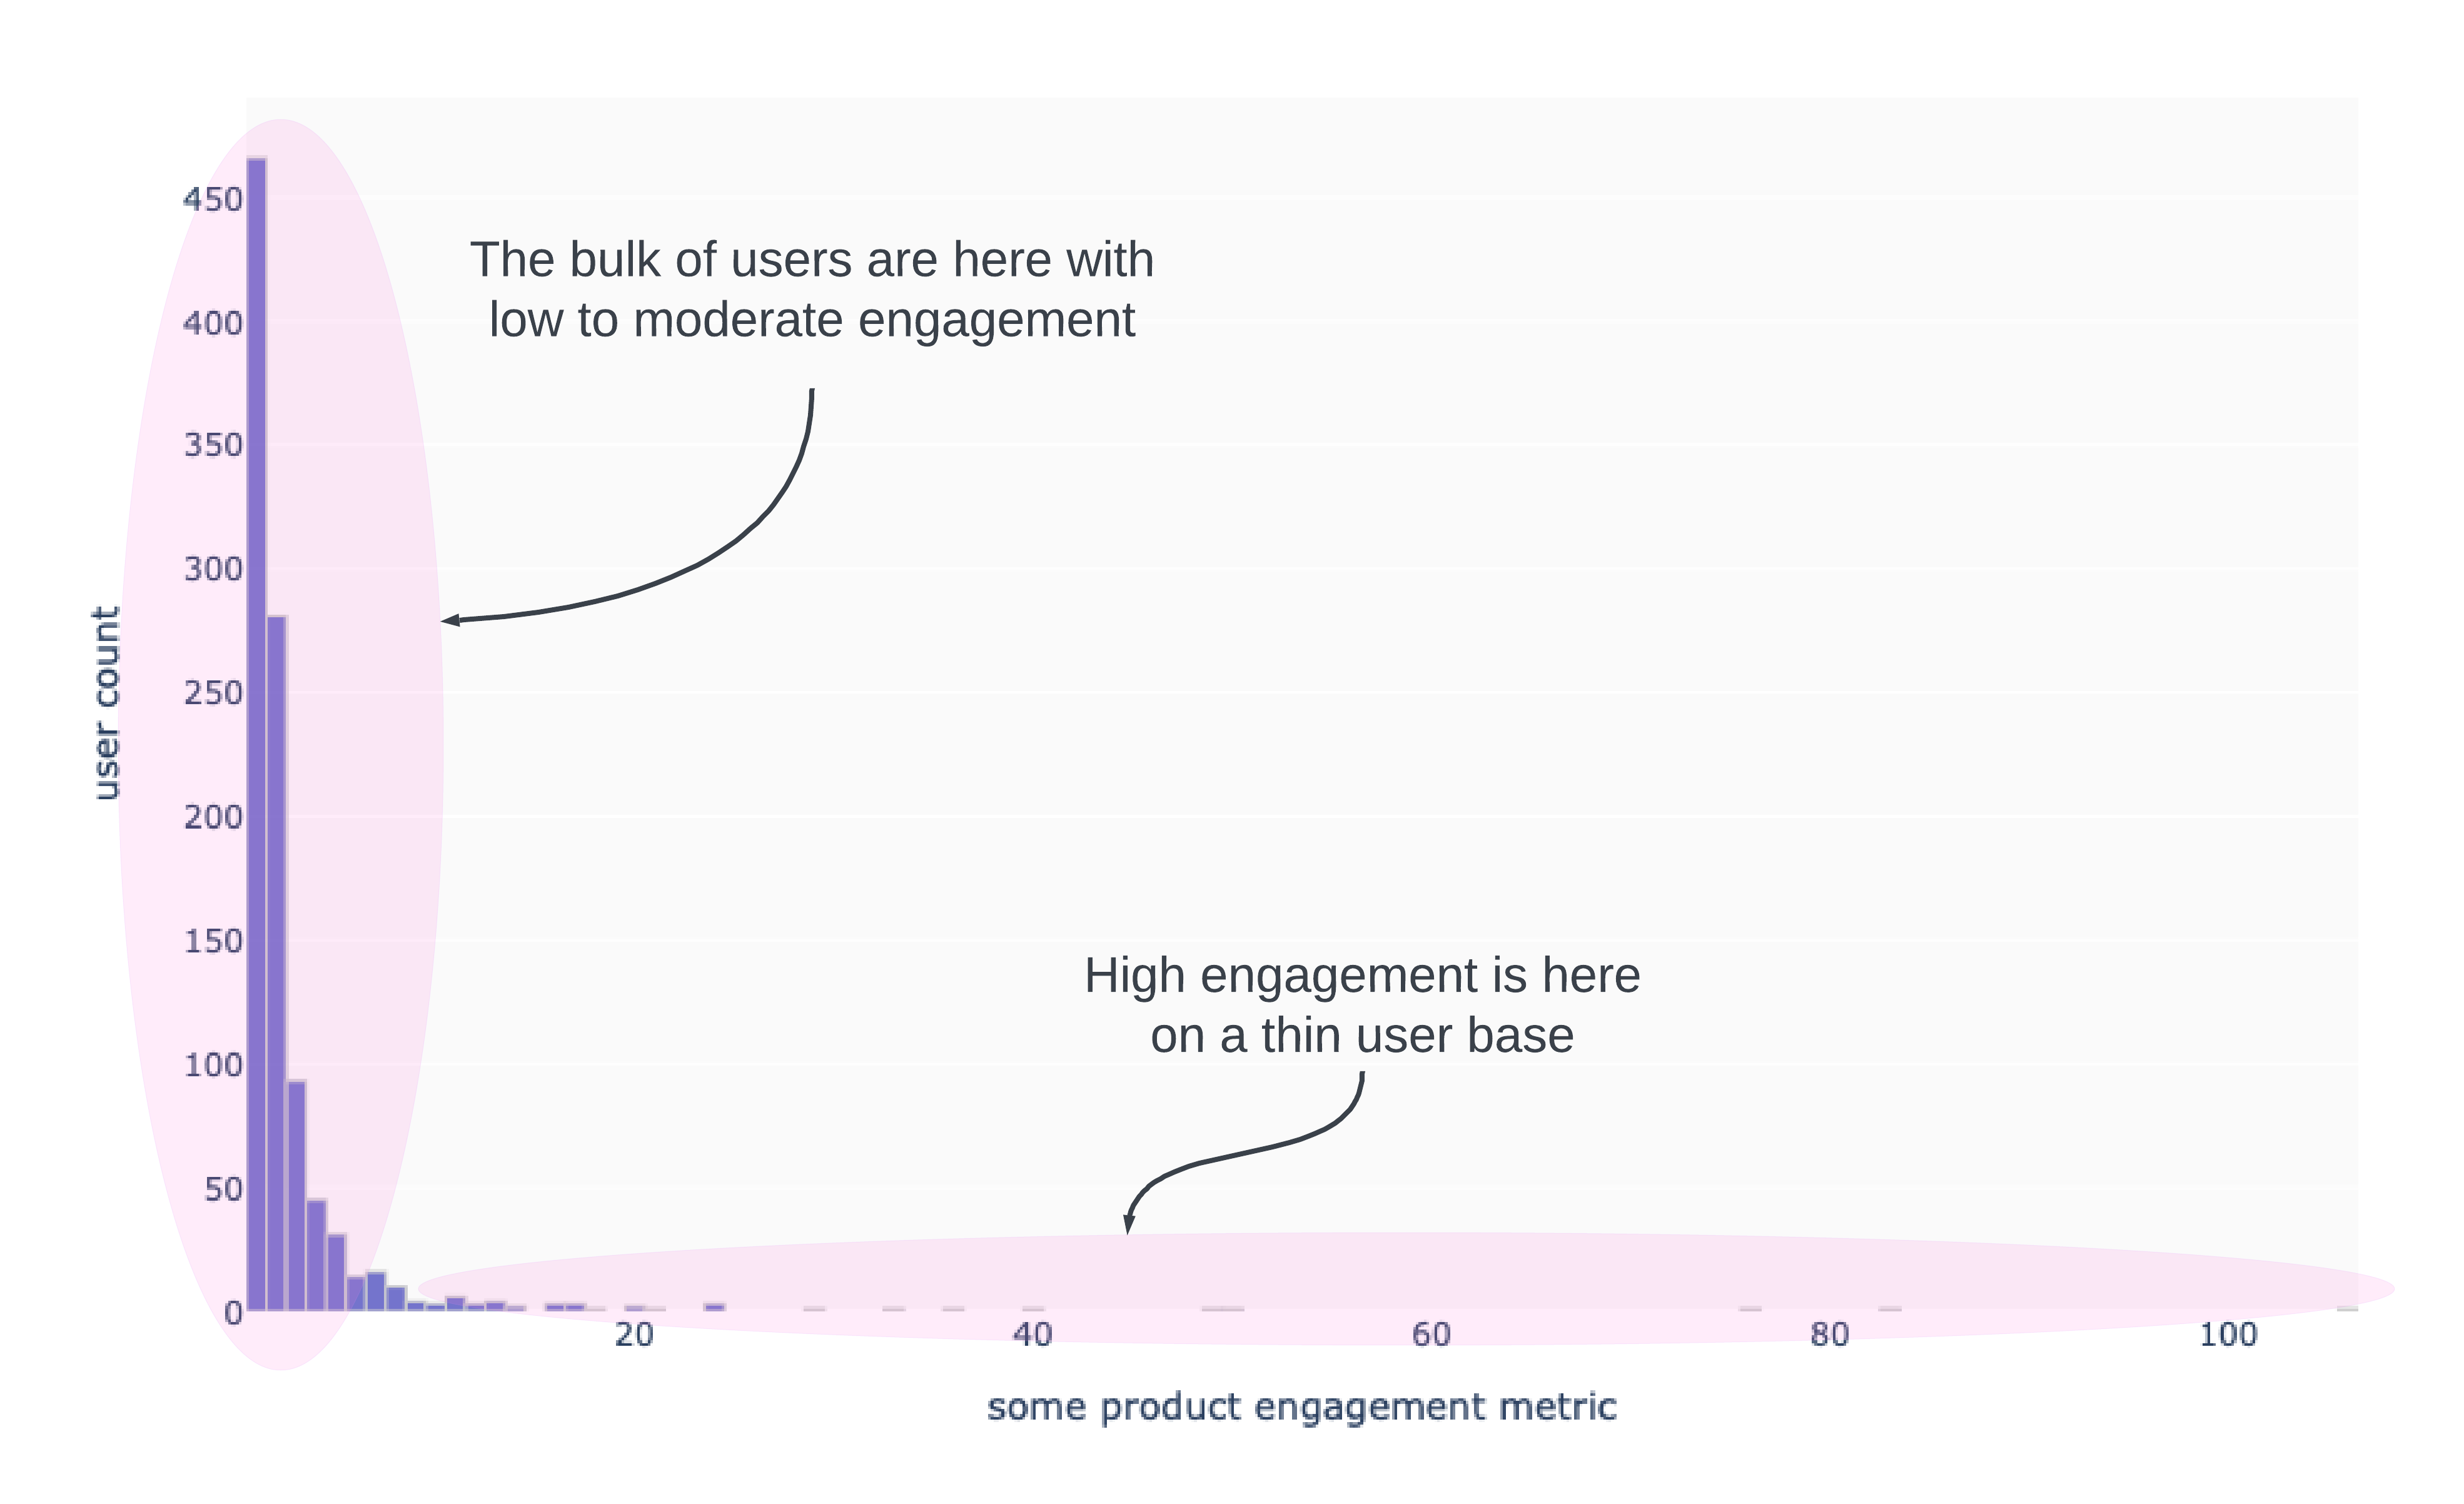
The struggle then is what is the measurement? Many product managers will opt for using the median over the mean because the median is stable. As a numerical example, suppose we have the following of 1038 users:
| Engagement Level | Count of Users | Percentage of Users |
| 0 | 600 | 57.8% |
| 1 | 250 | 24.1% |
| 2 | 100 | 9.6% |
| 3 | 50 | 4.8% |
| 4 | 20 | 1.9% |
| 5 | 10 | 1.0% |
| 6-100 | 5 | 0.5% |
| 101-1000 | 2 | 0.2% |
| 1001+ | 1 | 0.1% |
The average engagement level for this data set is 3. The median engagement level is 0. The average value of 3 feels too high because 92% of users have an engagement level lower than 3. The distorted average is a consequence of right skew in the data and trying to move this number doesn’t seem to make much sense because you’d have to get users to engage two to four times more than than their current level, or you have to acquire more extreme users. The former may be a tall order because that’s a massive shift in behavior. The latter can have chaotic consequences for your platform [content is dominated by a handful of users thereby disenfranchising / discouraging smaller creators because their work doesn’t get noticed OR your hosting and storage costs start to balloon with not enough monetization to support the use].
The median, in some sense, is more representative since that’s the number that in theory, separates the data into half and it is “robust to outliers” (a technical phrase to mean that the value of the median is not influenced by a handful of extreme points, unlike the average). And so, product managers opt for median as the benchmark point to move.
But guess what?
The median is NEVER moving. This is discrete data. Not continuous data. Take the table from above, but scale it up by a factor of 100 for a retail product with a million users.
| Engagement Level | Count of Users | Percentage of Users |
| 0 | 600,000 | 57.8% |
| 1 | 250,000 | 24.1% |
| 2 | 100,000 | 9.6% |
| 3 | 50,000 | 4.8% |
| 4 | 20,000 | 1.9% |
| 5 | 10,000 | 1.0% |
| 6-100 | 5,000 | 0.5% |
| 101-1000 | 2,000 | 0.2% |
| 1001+ | 1,000 | 0.1% |
If the user base stays the same and retention is 100% and those with engagement levels of 1 or more also don’t change their behavior, we’d have to move roughly 81000 users with 0 engagement to engagement levels of 1 or more. That’s 8% of the total user base or roughly 13.5% of the unengaged users! This doesn’t happen. It doesn’t happen overnight and it doesn’t happen in a quarter or two either.
You see what’s happened here is that the product could be improving. The new feature could actually be an improvement, but setting up success on the ability to move the median is a set up for failure for no other reason than a mathematical one!
You may ask “couldn’t I see small changes in the median as more users trend toward higher engagement?”. The answer is no. There are only three numbers you will see. 0, 0.5, and 1. The 0.5 only happens if you have an even number of users AND the “last” user at 0 engagement is just below the 50% mark and the “first” user with 1 engagement is just above the 50% mark. This isn’t happening either in practice. The median on discrete data is going to be discrete.
What needs to be done is — and if you know me, you’ll have guessed it — setting up a statistical test to see if the distribution has changed. Because if you were able to move, say, 8,100 users instead of 81,000 to engagement level of 1 from 0, that’s actually a success! A statistical test can be set up to measure various types of change in distribution.
Another way is to compute a Winsorized average where the impact of extreme behavior is softened but not eliminated.
In either case, be it a statistical test on the distribution or a modification to the metric, we’re addressing the quality of measurement to better reflect the intention of the product. Not the other way around!
The lesson here is while there are psychological and cultural effects leading to product failure for chasing measurement, there is also the less discussed self-created failure because the measurement to move was impossible to move. The immovable object wins.
Please reach out if you want to review your product metrics and set up statistical reasoning to see if your product improvements are moving your north star metricS (plural!).